21
Aug 11
Estimating Organic Search Opportunity: Part 1 of 2
As an SEO practicioner, you will often find yourself in the position of having to estimate traffic potential. If you’re like me, you’ve probably used the AdWords Keyword Research Tool to do this. Most people do this with “Exact Match” turned on and use the “Local Searches” number, then make assumptions about what position they might be able to obtain on average, then they assume an average click-through rate based on various studies that have been done on click-through rate versus position. For individual keywords, the click-through rate in reality will vary widely from the average, but if you’re doing estimates for hundreds or thousands of keywords this should “all come out in the wash”.
I’ve done this exercise numerous times but have always had the sense that I’m probably overestimating, because the traffic amounts predicted didn’t materialize, even when positions were achieved.
These two postings will identify the reasons for this, and we’ll construct tables that can be used to easily estimate organic opportunity based on position.
The Three Problems
1.) Search position studies vary widely, and are somewhat confusing.
2.) Some impressions will go to paid search and aren’t really available.
3.) Some impressions result in ZERO clicks (!) and aren’t really available either.
1.) Search position studies vary widely, and are somewhat confusing.
There have been a number of studies on average Click-Through-Rates in search engine results pages (SERPs). The most famous is probably the informal studies that individuals made of AOL’s search engine data that was released into the wild in 2006. AOL released anonymized (so they thought) data, as a courtesy to the academic world in order to foster more research in search. Once the data was out, some folks quickly realized that some users had searched on personal information such as their own social security number or address, and then had performed various embarrasing searches. I believe this was before AOL began contracting with Google to provide their search results, so it isn’t necessarily perfectly applicable to Google search results, but the data, for a long time, was the most detailed available.
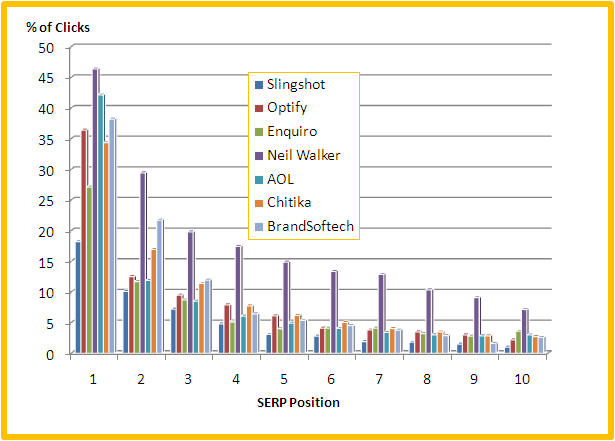
There have been a myriad of other studies on CTR at various positions, and a cursory look shows a wide variety of results – for position 1, for instance, ranging from 42% of clicks to 16.9% of clicks. Here are the various studies followed by a graph of their results:
Slingshot: http://www.seomoz.org/blog/mission-imposserpble-establishing-clickthrough-rates
Optify: http://searchenginewatch.com/article/2049695/Top-Google-Result-Gets-36.4-of-Clicks-Study
Enquiro: http://searchenginewatch.com/article/2100616/Top-Google-Ranking-Captures-18.2-of-Clicks-Study
Neil Walker: http://www.seomad.com/SEOBlog/google-organic-click-through-rate-ctr.html
AOL: http://www.blogstorm.co.uk/google-organic-seo-click-through-rates/
Chitika: http://insights.chitika.com/2010/the-value-of-google-result-positioning/
BrandSoftech: http://realtimemarketer.com/serp-click-through-data-defining-the-importance-of-google-search-rankings/
There are a number of reasons why these studies vary so widely, including exact match vs. broad match, results including universal (blended) search results versus non-blended, and click-weighted average data versus median data. I took a look at the various studies and tried to determine which ones, and even which subsets of data, are comparable, and selected four datasets to use:
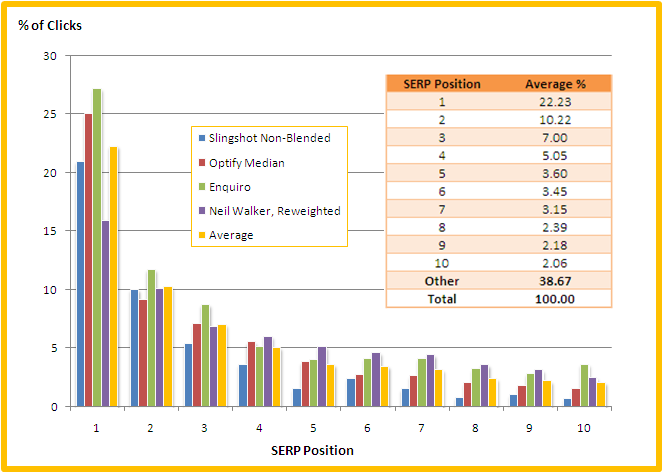
1. Slingshot’s “non-blended” data (since most of the other studies don’t really address Universal Search). There is an anomaly of a small bump in position 6 which makes me suspect the dataset size isn’t large enough, but the curve overall looks correct.
2. The Enquiro data
3. Optify’s data – but instead of the widely publicized *very high* click-weighted average numbers , we’ll use the “median” data.
4. Neil Walker’s data – but since he notes the percentages add to more than 100%, I have scaled all numbers proportionately down. As a scaling factor, I selected one which makes all the non-page-1 SERP traffic add up to the average that the other three curves had, which is about 38%.
Below you can see that the datasets selected are much more tightly grouped and in agreement, and we’ve calculated the average click-through-rate by position:
Now, don’t get excited and all hung up on these average values; we are going to correct them slightly later. But they give us a great basis to start fitting a curve to the data.
Fitting a Curve
Search results, like many things, follow a power law distribution. There has been a lot of research on how and why people click on various positions; the two major models the academic community has come up with are the “positional” and the “cascade” models. The “positional” model assumes that people are looking at various positions and homing directly in on what they want to click on; the “cascade” model assumes people are scanning through each entry, with a set probability of moving on to each next entry. Both models come up with very similar results and can be approximated by a simple power law curve. Doing a power curve fit to our data will allow us to extrapolate it beyond the first page of the SERPs, and we can then use that curve later in making organic estimates for a variety of positions greater than 10.
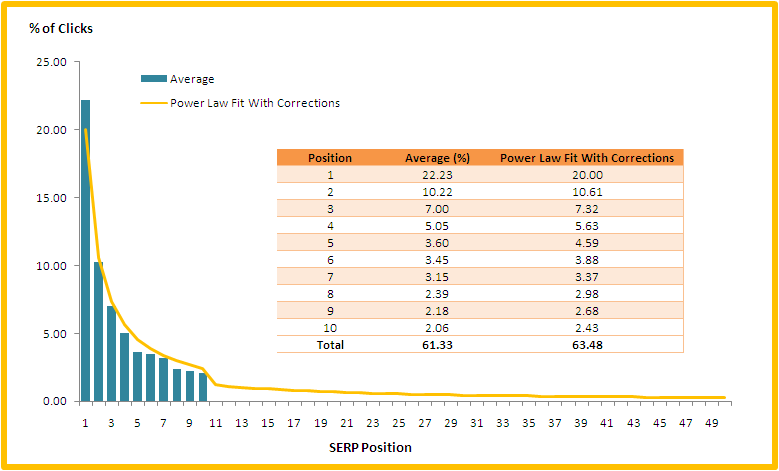
By adding a trendline into Excel (if you’re curious, it was Y=20*X^(-0.195)), we get a trendline with a *great* fit, that has a greater than 99% R-squared value. In fact, I like this curve better than the average we established because it gives a better value for position 5 which was probably skewed by that one suspicious Slingshot data point, so we will actually use the values generated by this curve itself rather than the average values going forward.
I then made a few corrections to the curve so that it would satisfy two constraints that aren’t conveyed in the original data:
1.) It’s been well established that moving from position 11 to 10, 21 to 20, and so on (in other words, bumping from the top of one page to the bottom of the next) results in roughly twice the bump that a one-position increase at that point in the curve would imply. The AOL data showed this, as well as the more recent Brandsoftech and Chitika studies.
2.) Totally an arbitrary constraint; I wanted the traffic beyond position 100 to be no more than 5% of the available clicks. This is because in the real world, people using position data to make calculations subscribe to various services that check SERPs for them, and at most collect only data up to position 200. Let’s face it, if you are in position 101 and you’re getting some data for a particular keyword, that data is worthless – it’s too small to figure out what traffic you’d be getting in position 15 if you moved up, and you’re fooling yourself if you think you can use it for that. 100 positions is probably pushing it actually, but since works out to 95% of traffic, that seems like a reasonable place to end our table (since it’s a power law fit, it could essentially go on forever, although with ever-tinier numbers). I may be sacrificing accuracy and correctness for usefulness here; if others have any ideas on this front I welcome them.
The final curve, with corrections, is presented here in figure 3:
In part II, we will cover the other two problems in generating organic traffic estimates; impressions that aren’t available because they go to paid search, and impressions that aren’t available because they have zero clicks (these are called “abandoned” searches, and are very notable in that they are little-talked-about, particularly by Google). Then we’ll construct tables for positions 1-100 that can be used to estimate traffic potential levels, both for new keywords, and for existing keywords that you have a track record of ranking for already.


I have been reading about this a lot and this articles was the best, and I expect to get some answers from part II. Because in my opition real CTR is much much lowe than all these popular statistics like 42% for #1…
How do you know the total search volume to be able to calculate that you are only capturing 42%? Your site could be moving up and down in the results and you not knowing it? There are also other factors that play into it… Your title and description tag, the keyword you are targeting versus what you are offering, etc.
There are just too many variables to be able to estimate the amount of traffic you’ll get. So I guess the main word here is “Opportunity” and you have to set the right expectation with the owner of the website.
Clearly state to the client that this is just their “potential opportunity” and many variables factor into to this so it will be important to monitor and analyze, not just link build. This is especially true for local searches because the organic listing can get pushed down pretty far and be crowed with the map listing and PPC ads.
Jim Rudnick, (Canuck SEO), sent me to your article and I am glad he did.
After well more than a decade of SEO the traffic equation is never satisfied.
Google keywords is great for discovery but their numbers should be taken with a grain of salt.
Let me describe an actual case.
Client’s product keywords were searched for and a 4 word phrase showed the highest search volume (2700 global 1700 local) for the niche.
I got the client the #1 spot and we waited.
Even at the lowest average 22.23% the #1 should bring in 600 Global and/or 378 Local
In one month we had 3 visitors use the term.
Hardly the posted numbers.
On my own site, Google Keywords told me “Up to date SEO information” was not showing any traffic. “Too small to be measured” .
I get about 20 searchers a month coming in with the exact phrase. Over 100 considering variations “Current SEO information” or even SEO information”.
I don’t much consider the numbers, but the keyword discovery process is a good one, often suggesting a wide range of possibilities. The numbers are ignored for their value but used as a yardstick for frequency.
Plugging in your domain name and leaving the kw suggestions blank can also help. The tool will tell you what keywords are on your site, as seen by Google.
Actual searches determine the competition.
Broad for an idea of the market and exact for the competition.
None of these metrics are exact, as it is not just the position but the presentation of relevance in the listing.
There is more than one factor.
Therefor we should expect that #1 will bring in more then #3 unless the #3’s listing has something that attracts better than it’s neighbors.
I rank #3 for 2 terms for my graphics site.
Google tells me that graphic filters is used close to 3000 times and plugin filters is used just under 50,000.
Graphic filters brought 17 visitors to my site this YEAR and Plugin filters 5.
best,
Reg
nbs-seo.com
Wow, Reg. Sad numbers there on your plugin and graphics filters. Have you tried changing your title and/or description tags? If you’re only getting that many click-thrus and if the stats are correct, perhaps the snippets don’t look relevant or appealing enough to entice a click. But they’d have to be really bad to cause that much disparity. You’ve got me questioning those numbers now too.
I have a similar issue when comparing rank and search impressions to actual clicks. I just came onboard at a company where we already rank highly for 10 or 12 search terms that should be bringing in about several hundred clicks (based on Google’s traffic estimator, our current placement and a conservative estimate of value). Bing seems to have much more information on the actual number of searches created. Unfortunately Bing also ranks our site in far fewer keywords for some reason.